Victoria Mollard, Executive General Manager, Economics & System Security
Future Grid Summit 2025
Parkroyal, Sydney
Hello everyone. Thank you for inviting me here today to speak.
I’d like to acknowledge the traditional owners of the land in which we meet today - the Gadigal people of the Eora Nation – and pay my respects to Elders past and present.

Our AEMC Commissioner Rainer helpfully set this scene just now with his discussion about Niagara Falls, Nikola Tesla and the moment The World Changed as well as a comprehensive overview of our work program.
Rainer has done a great overview of the AEMC’s work program – so I’d like to talk today in a bit more detail about what makes our experience in Australia especially interesting and unique – particularly in relation to households. I will then talk about the AEMC’s Pricing Review, which is considering future electricity products and services, and the prices consumers pay for these.
The Energy revolution in our homes

Australians really like new technologies, and always have.
First Nations people are credited with forming one of the most technologically advanced societies in the world here in Australia.
The boomerang harnessed asymmetrical lift, which is one of the most complicated principles of aerodynamics, enabling it to curve and return to the thrower.
Another great Australian innovation is Google Maps, which took shape 20 years ago in a spare bedroom in Hunters Hill, barely eight kilometres from here. It now boasts more than 2 billion global users a month – and I often use it to follow that blue dot to tell me where to go in a city using this technology to come here today!
One of the more compelling examples of Australians’ embrace of new technology is the way we have taken up consumer energy resources (CER).
These are smaller-scale energy resources owned by customers, which can produce, store, or vary how consumers use energy.
CER has been around for a while, with traditional assets being hot water heaters, pool pumps – and solar panels.
More recently, we’ve seen newer forms of CER being integrated into the system such as batteries and electric vehicles. And through innovation and technology, we’ll see new types of that we haven’t even thought of yet, being integrated into the future.
Australia’s energy landscape is being transformed by the uptake of these resources. Consumers are becoming more engaged in the different ways in which they can use, and benefit from CER. This has flow-on implications to the system: for decades, electricity flowed in one direction from large-scale generation down to consumers. It now flows in two directions, with consumers increasingly exporting back to the grid and sharing the energy with their neighbours.
We are seeing energy service providers such as retailers and aggregators innovating to provide new offerings to consumers to respond to their changing preferences and demand for such products. This includes products such as solar soak products and virtual power plants (VPPs), which seek to reward consumers for using energy more flexibly where they can, and contribute power back to the grid for the benefit of others. CER is clearly a driving force of change in our energy market.
Australians are known as being leaders in the take up of roof top solar. We have enthusiastically adopted solar on our rooftops over the past 15 years. This has been driven by our desire for clean energy, as well as government subsidies that have encouraged this trend.
Currently, 32 per cent – or one third - of standalone Australian homes and small businesses have solar. If you add this capacity together, rooftop solar is actually the largest generator in the NEM!
Of course, in relation to solar, I’m not telling you anything you don’t know but it’s how these new technologies are being taken up that is exciting.
CER is a core element of AEMO’s Integrated System Plan – the 2026 version of which is being published shortly.
So, we at the AEMC, translated the most recent data from AEMO’s input, assumptions and scenario work that was released in July this year, into household level data. This involved deriving projections of CER uptake and dividing these projections by forecast household numbers.
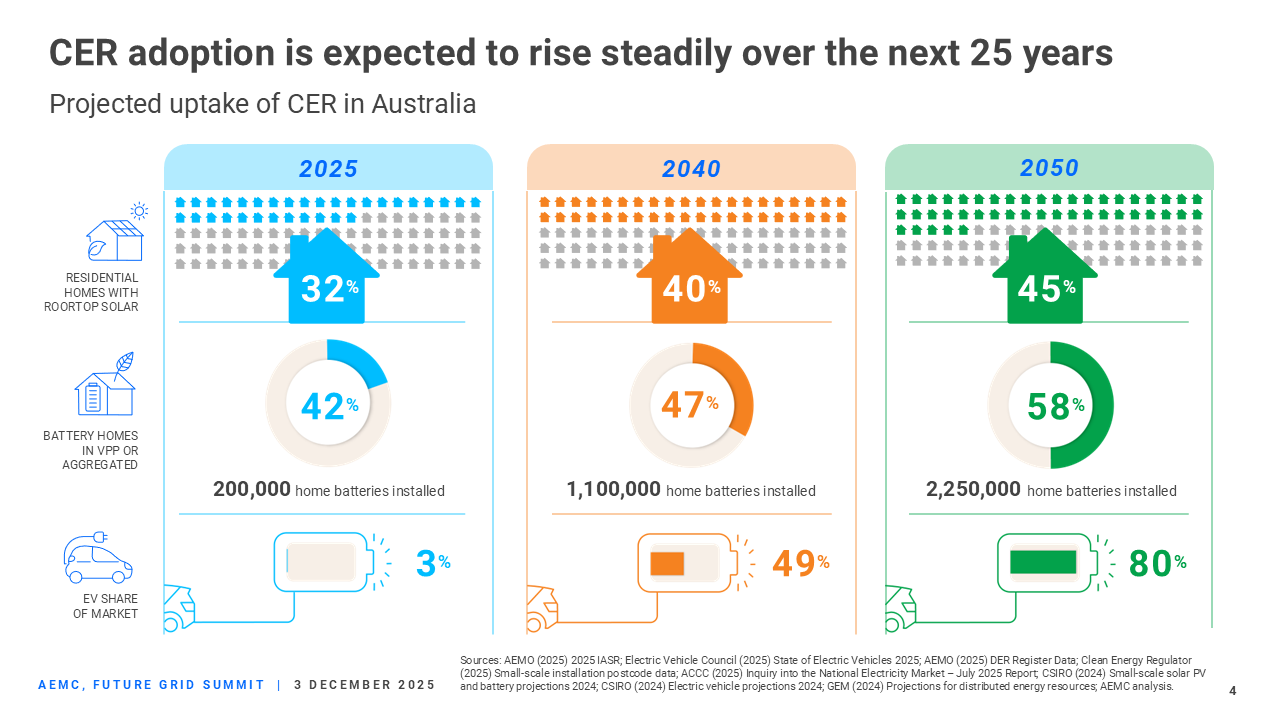
Looking into the future, CER uptake is projected to rise steadily – we can see this on this figure which maps out 2025 to 2040 to 2050. If the economy evolves according to the ISP’s step change scenario, then by 2050:
- 45% of homes will have rooftop solar, compared to 32% today
- 58% of home batteries will be by a third-party aggregator, and
- 80% of cars on the road will be EVs, compared to 3% today.
So, this helps show that CER and its resources will only become more important to the grid over the next 25 years – as both a component and enabler of our energy transition story.
These numbers include 200,000 home batteries installed up to 30 June 2025. However, since this data was published the uptake of home batteries has surged further. This data doesn’t include those installed since July 1 under the Cheaper Home Battery program. About 1,000 Australians are installing a solar PV system with a battery every day – over 90,000 solar batteries were installed between July 1 and October 31 this year.
In the four months following the program’s start, based on our analysis, total battery capacity has grown at an annualised rate of 344%, compared to an average annual growth rate of 40% over recent years. It well exceeds the 65% average annual boom in the installation of rooftop solar systems that occurred in the peak period between 2010 and 2015.
This shows that the Australian embrace of new technology doesn’t wane. And if this uptake continues, it’s going to have an even more profound impact on the system than we expected. It will make up a substantial amount of our energy mix and portfolio.
It is also reconfiguring our energy supply chain. This is a figure that has been developed by our economics team that shows how CER uptake and the electrification of appliances and vehicles are redirecting flows across our energy supply chain.
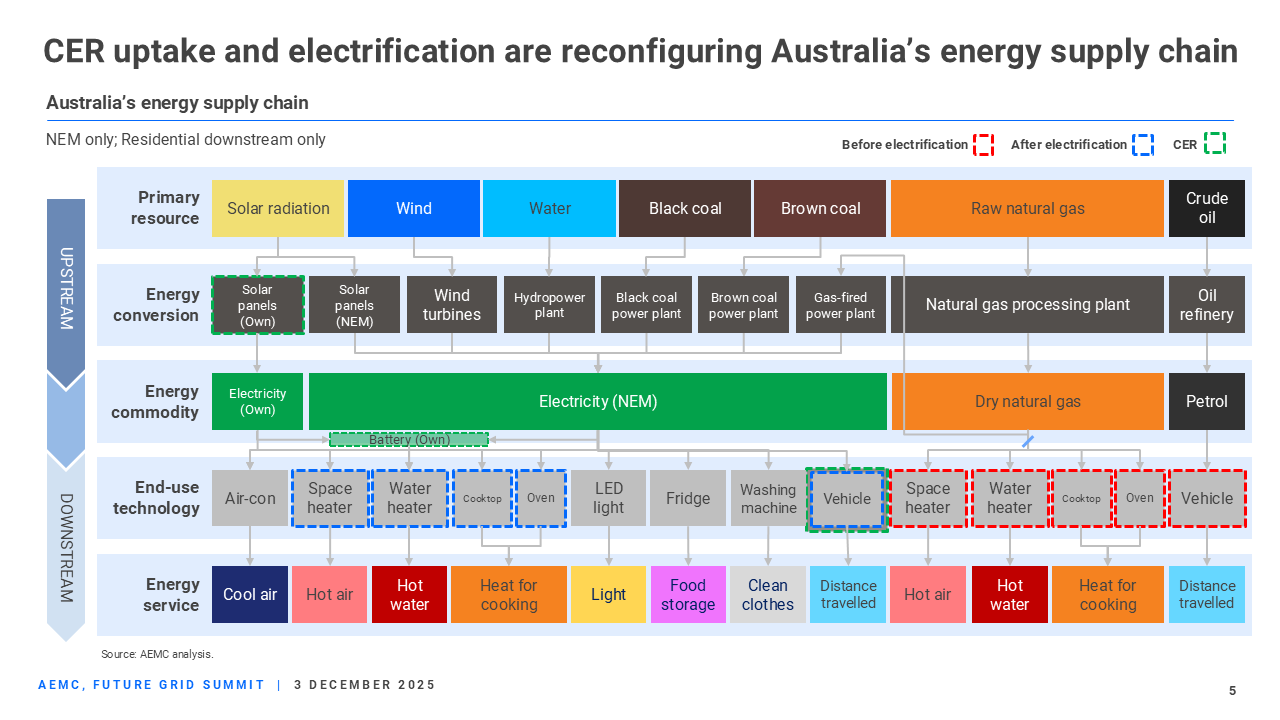
So, you can see at the top that it shows the various primary resources that we use to produce energy in Australia – ranging from the various renewable sources, coal, gas and crude oil. That then flows through into how each of those resources gets converted into either electricity, gas or petrol.
Working through this further, we can see that electricity / gas / petrol gets used to power a wide range of end use technologies – such as the fridge that stored the milk for our breakfast we ate this morning, the water heater enabling us to have a shower, and the vehicle that brought us here today. These translate into the services that we all benefit from.
This shows how the supply chain can change through electrification – before electrification consumers use the red end use technologies shown on the right hand side of the chart; after electrification, these technologies can be used powered by electricity.
We can also see that the installation of CER further disrupts this supply chain – an electric vehicle – if enabled, can actually push electricity back to the grid and this can be used to power other end use technologies; similar to a battery.
By the end of this journey, if a household has electrified, we can see that a household is enjoying energy services like hot and cool air, heat for cooking, and lighting, by relying entirely on electric assets and using a solar battery system.
In order for customers to benefit from this, we need to make sure the transition is well-managed and equitable so that all households benefit, not just those who can access new technology immediately.
While this chart focusses on the consumer level, electrification and CER installation also has a substantial, offsetting, impact on the grid. While electrification would generally increase electricity imports and therefore has the potential to increase grid strain if not well managed, the opposite is also true. We can use CER installations to help decrease pressures on the grid and alleviate congestion, potentially at the extreme decreasing substantially electricity imports.
There are many reasons why consumers may want to electrify. This includes benefiting from cleaner, greener consumption, however, there are also potential cost savings. A lot of electric home appliances are more energy efficient than gas appliances – they do the same task using less energy and at a lower running cost.

We’ve been interested in understanding how this all plays out in the “real-world” for consumers.
Our in-house economists have undertaking some analysis to help illustrate this. I will specifically call out Matthew Trachevski for his work in pulling this together.
The first thing to understand is the ‘quantity’ impacts – which is where energy efficiency comes into play.
In general, electric technologies are more energy efficient than gas and petrol counterparts.
You can see here that replacing an inefficient appliance or car with an efficient one allows a household to reduce the quantity of energy it consumes.
What we have done here is converted the ‘energy usage’ for each technology into a common unit of a megajoule – a unit of energy. If we start on the left hand side of this chart, we can see that if you replace a gas ducted space heater – which produces about 0.6 MJ of thermal energy for every MJ of natural gas you put into it – with an electric reverse cycle air conditioner which harnesses thermal energy outside of it to produce about 4 MJ of thermal energy for every MJ of electricity you put into it, you will divide your heating bill by approximately 6. That is, the reverse cycle air conditioning is nearly 6 times more efficient in pure energy terms compared to the gas heater.
As you read across the charts you can see that there are similar efficiency savings to be had through other electrification of key technologies including water heating and cars.
In contrast, the energy efficiency differentials for electric vs gas cooktops and ovens are much smaller, at 2.2 and 2.0, respectively.
These energy efficiency differentials are important to us at the AEMC. They represent gains in what we would call ‘productive efficiency’. This is about providing services at ‘lowest cost’ – and is a concept that features in the National Energy Objectives we must consider in our work and decision making.
We would also expect that future innovations would make household appliances and electric vehicles even more energy efficient in coming years, and so these numbers may benefit further.
And next, we have some examples showing load profiles in different Australian capitals, before and after electrification.

So in these figures, we’re looking at how much energy a household in Melbourne uses during a typical day in October. The left-hand side shows before electrification, where they’re using a gas-ducted heater, a gas instantaneous hot water system, a petrol car, and so on, and the right-hand side shows post-electrification.
The load profile after electrification shrinks to be about one-fifth of the load profile before electrification, driven by those energy efficiency differentials on the previous slide.
As another example, here’s a household in Brisbane in January, before electrification on the left-hand side, and after electrification on the right. The reduction in energy consumption is not as large as it is in colder climates and months, as heating is limited there, but it is still substantial.

What these figures emphasise is that switching to efficient electric assets allows households to enjoy the same energy services using a fraction of the energy used by typical gas and petrol assets.
We’ve seen that electrifying appliances and vehicles can significantly lower the quantity of energy you use. But there’s also price, the other component of a household’s energy cost – and the one we’re most focussed on as energy users ourselves.
The figure on the left shows that average electricity usage rates, when converted to the common energy unit of MJ, are about double gas usage rates. And when we convert litres into MJ, we see that electricity usage rates are also about double petrol prices.
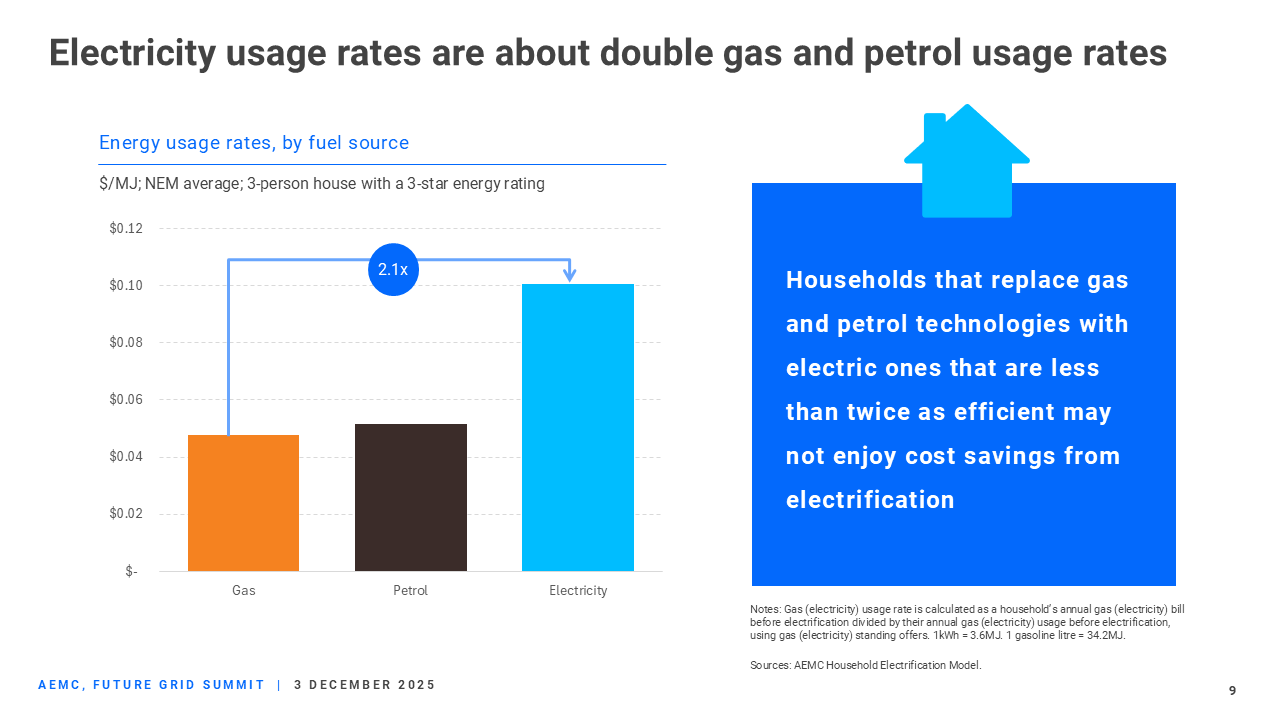
This is stylised but it is helpful to understand. While electricity is more expensive than other fuels, given the energy efficiency benefits, consumers can still be better off by electrifying. The analysis by our economists suggests that the price of electricity relative to other energy prices doesn’t spoil the energy efficiency gains made by electric technologies in most cases.
So if we combine these two factors together, the cost and quantity impact, we can find that:
Electrifying space heating lowers a household’s annual space heating energy cost by 65% AND
Electrifying a vehicle lowers a household’s fuel cost by 57%. Whereas
Electrifying a cooktop lowers its cooktop energy cost by only 6%.
Bringing it all together
This gives you an insight into some of the unique challenges and opportunities that we are facing in Australia, including the growing scale, pace and engagement of CER in a grid that covers vast distances and multiple jurisdictions.
The unique nature of the CER in the Australian system means that we often have no choice but to invent new solutions because no one else can answer the questions we’re asking.
CER provides opportunities for those who are heavily engaged, solar app wielding afficionados who actively hunt down great deals and navigate the system with relative ease.
But we also want to factor in anyone who has any device with flexible load, like dishwashers or air conditioners – many of us have these in our homes already fitted with built in timers or delay start functions.
We also need to consider consumers who even if they have all the toys that new energy technology can offer, just want a simple price for a simple service.
So, if we integrated CER well and we meet the needs of all customers, it means:
Everyone can save money, by choosing how and when they use energy
We see lower overall system costs and improved reliability, which again benefits consumers
Those who engage actively with their CER technologies can reap greater rewards by allowing their assets to participate in the wider power system
The market operator can more efficiently match demand and supply and manage system security
And perhaps the greatest benefit is that we’ll collectively help Australia achieve a net zero energy system.
One of the main benefits of CER is that it allows a household to be more energy self-reliant.
There could be days when they completely avoid importing electricity from the grid. At the extreme if someone has electrified with a solar system and a battery, then they may not import anything from their retailer. Their gross electricity load will be covered directly from their rooftop solar generation, and by discharging excess solar stored in their battery.
Households can generate so much electricity that they’re able to consume energy, store energy, and export energy to their retailer.
CER and DER integration to benefit all consumers
An interesting consequence of CER installation is that, as it accelerates, we may see a smaller, remaining pool of households without CER left to foot the bill for electricity network usage costs. As we just saw, when consumers install batteries, electricity imports drop. This likely means that customers with CER are under-recovering their network’s average residential revenue requirement. As CER adoption grows, this may compel networks to recover costs in new ways.
Currently, around 70% of network costs are recovered via usage charges, rather than fixed charges.
If, in response to declining network usage, networks raise fixed charges then all customers, including those with CER, would experience a small network increase. If networks raise usage charges then households who don’t install CER and are reliant on grid imports will pay a lot more, particularly those who can’t shift usage from high demand times.
This raises important equity concerns that we are navigating with the help of the AEMC’s equity principles. These state that equity should be considered by the AEMC in its decision-making where equitable outcomes would improve or maintain efficiency, or where awareness of equity impacts could ease consumer impacts. These principles draw on academic frameworks have been applied to one of our major projects – the Pricing Review.
And this is a great opportunity for me to share that we’re currently putting the finishing touches on the Pricing Review and will release a draft report next week. It will feature a draft roadmap that could be implemented over the next 10 years to tackle a range of issues – including helping us navigate towards this future !
So please keep an eye out for its release.
Conclusion
The CER revolution continues Australia’s love affair with innovative technology – from the boomerang, to google maps, to CER in our homes.
The AEMC is often at pains to remind people that we are technology agnostic – we don’t pick winners. And this is true. But putting in place market frameworks that encourage innovation has long been central to everything we do at the AEMC.
Frameworks that are enablers of innovation, investment, and growth will be essential, both to the development of a domestic industry and the future growth and competitiveness of our energy sector.
We look forward to working with you, the industry, and its stakeholders as you take these critical next steps on a path towards innovation and growth.