Charging ahead: Residential batteries are growing in popularity and profitability
Authors: Mark Nuttall, Tom Miller, AEMC Analytics & Economics
Introduction
Australia is famous for achieving world-leading levels of rooftop solar adoption over the past decades, which begs the question of whether we will see similar levels of rapid uptake in other CER resources like residential batteries. Unless mentioned, ‘batteries’ in this article refers to ‘residential batteries’ from this point onwards.
The AEMC first investigated the affordability of batteries in 2022, and this article extends our analysis by:
- Using updated data on the range, cost and features of batteries currently available
- Creating several new models of battery dispatch and optimisation
- Using real hourly consumer load data to model the financial performance of available batteries
We found that the average payback period for a battery without any government subsidies was 14.5 years, but this can be reduced to 7.3 years under the federal rebate. If a NSW battery owner was to participate in a virtual power plant (VPP) scheme and thus be eligible for both the federal rebate and NSW VPP incentive, the average payback period could be as low as 4 years.
These are average results, and individual results can vary widely. Some individuals see payback in as little as two years, whilst others may not see returns until long after their battery warranty period has expired. This highlights the highly individualistic nature of battery economics, as consumer characteristics and behavioural choices can significantly affect profitability.
Importantly, we are looking at paybacks from a consumer perspective, taking current (NSW) retail pricing as given. These consumer benefits are different from overall system benefits.
In 2022, the AEMC examined the emerging economics of batteries, concluding that by 2025, installations could become financially viable for many Australian households. This result was predicated on a hypothesis that battery prices would continue to fall. While this has not necessarily borne out for individual batteries, the range of batteries available to the market has increased, with a number of more affordable batteries gaining popularity.
In addition, the recent introduction of state and federal incentives is significantly reducing upfront costs, while falling solar feed-in tariffs (FiTs), rising time-of-use (ToU) peak charges, and increased wholesale market volatility have all improved the potential profitability of battery operation.
The battery market has seen significant growth since our initial analysis. Between June 2022 and June 2024, the number of batteries installed across the NEM grew by more than 80%. However, this strong increase comes from a low base with only 4.1% of solar households currently being accompanied by a battery (source).
So how do batteries create value for consumers?
Batteries generate financial value by arbitraging electricity costs, charging when prices are low and discharging when prices are high. Optimal arbitraging occurs when batteries charge using excess solar generation, which would otherwise be exported to the grid at relatively low FiT rates. Instead, this energy can offset more costly imported electricity during peak periods. For example, if the peak price under ToU is 50c/kWh and the solar FiT is 10c/kWh, then the arbitrage potential of the battery is 40c/kWh. This theoretically equates to circa $4 per day and $1,460 per year for a 10kWh battery that cycles once a day. This can be realized as long as the consumer’s usage in the peak period exceeds the storage capacity of the battery (i.e. they can discharge to offset self-consumption).
In some cases, individuals may opt to expose themselves directly to wholesale electricity prices, which fluctuate in real time. These are significantly more volatile and thus offer greater arbitrage potential, but this potential is also harder to predict or obtain and may introduce higher battery degradation if the battery is cycled more frequently.
What we did
The full methodology and assumptions can be found in the attachment. The following is a brief overview:
- We used a sample of hourly load data for 1,000 NSW consumers over FY23-24. Unless mentioned, results are the average of this dataset.
- We used a mixture of premium and cost-efficient batteries with differing storage capacities.
- We assumed consumers have solar and are on a popular market NSW ToU rate.
- We used 10-year Net Present Value (NPV)1 and payback period2 as our key financial outcome metrics.
- We built three models to tell the battery when to charge or discharge:
- A simple ToU operations model that charges using excess solar when the sun is shining and discharges otherwise.
- A complex ToU operations model that uses linear programming techniques to charge/discharge sensibly over a 24-hour forward-looking window.
- A complex wholesale operations model that uses linear programming and pre-dispatch data to charge/discharge sensibly over a 24-hour forward-looking window with results evaluated using dispatch prices.
- Our results assume that the consumer chooses the best available battery to maximise their 10-year NPV.
- Our models have limitations in that our simple ToU model likely undervalues the benefits of a battery due to its simplicity, whilst the linear programming models assume perfect foresight of household solar and load (importantly, not price), which can overvalue the benefits of the battery. However, we found similar results produced by the simple and complex ToU operations models, indicating that this limitation is minor. Future modelling efforts could use weather and load forecasts as indicators. Additionally, there are likely more sophisticated wholesale operations modelling approaches to maximise the profit from the battery.
It should also be noted that we do not cover other factors, such as safety concerns, technical standards, and other important considerations. These factors are important, and we encourage further work to be conducted in these spaces. Furthermore, this analysis is centred around NSW consumers, however, we expect the findings to follow similar trends for other states as many of the conclusions are state agnostic.
We found that changing market conditions and government subsidies are making batteries more attractive
We now have a broader range of battery products on the market
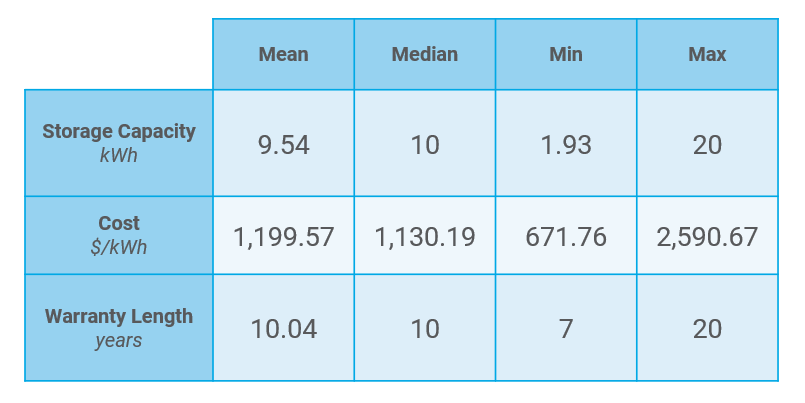
Today, Australian consumers can choose from more than 70 batteries, with prices ranging from under $2,000 to nearly $20,000. Most batteries have a storage capacity of around 10kWh, although some are as little as 2kWh and as large as 20kWh. Additionally, other relevant characteristics, such as rated power, warranty, and degradation, vary from battery to battery. This is to say that consumers can choose from a wide array of batteries to suit their specific usage profile, load and financial goals.
Figure 1: Most batteries in our sample have storage capacity around 10kWh, but cost per kWh can vary significantly
Tariff structures are evolving, with FiTs falling and peak periods changing
The economics of battery ownership have improved substantially due to changing tariff structures. Since 2022, in the Ausgrid network region:
FiTs have declined from an average of 6.8 c/kWh to around 4-5 c/kWh.
Peak ToU tariffs have increased, the largest offer rising from 44.8 c/kWh to over 75 c/kWh.
To put this simply, the widening gap between export revenue and peak import costs results in a larger arbitrage opportunity for battery owners.
Larger solar systems are becoming more common
Household solar PV uptake has continued to grow, alongside increasing system sizes. In the NSW Ausgrid region, the average system size has grown from 4.8kW in FY21 to 7.1kW in FY24. Larger PV systems generate more excess energy, which can be stored in a battery and used later, improving the utilization and returns from a battery investment.
Government subsidies reduce the upfront cost of batteries
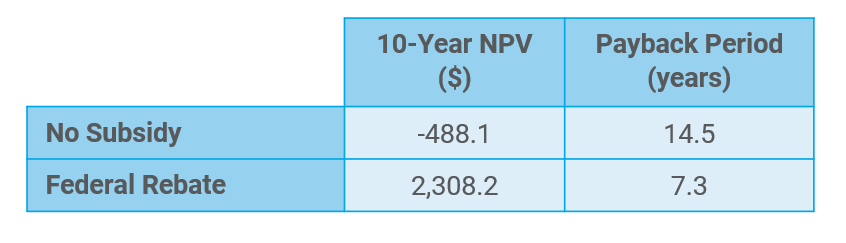
We found that subsidies are the single most impactful contributor when reducing battery payback periods. Without subsidies, battery owners may struggle to recoup their capital cost before their warranty period expires. For example, the recently introduced federal Battery Rebate (Cheaper Home Batteries Program) can reduce the capital cost of a battery by up to circa 50%, and the newly amended NSW VPP-based incentive can also assist with upfront battery costs. These programs offer cost relief depending on the storage capacity, which can halve the payback period and bring it below the warranty period (usually 10 years) for many consumers. It should be noted that batteries with a higher $/kWh cost will see a lower proportional benefit from the federal rebate (closer to 30%) because the subsidy is roughly $370/kWh.
Figure 2: The new federal rebate can halve payback periods for the average NSW consumer
We found that certain consumer behaviour can boost a battery's profitability
Evening Peakers stand to benefit the most from battery inclusion under current Time of Use Retail offerings
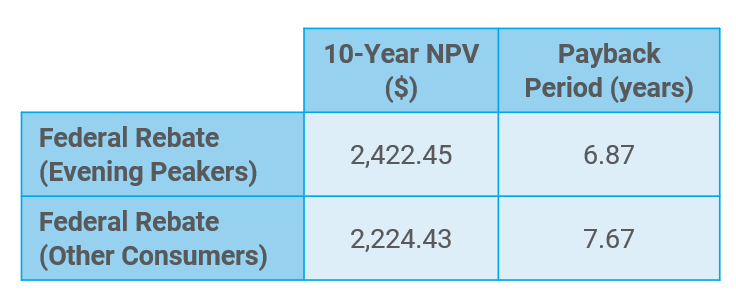
Individuals consume energy in different ways. Our analysis found that consumers with relatively high loads during evening hours—we call them ‘Evening Peakers’—are the most common consumption profile and are the clear winners when it comes to battery economics. This is understandable, given that under Time of Use retail offers, more costly peak prices apply in the evening when solar energy is unavailable. Evening Peakers have two attributes that allow them to achieve larger arbitrage and better battery utilisation:
They have sufficient ‘spare’ solar generation in the day to fill their batteries at the lowest possible cost. Solar generation is more likely to exceed daytime electricity usage when that usage is more modest.
They have sufficiently large electricity usage in the higher price evening period that the battery can be fully used to displace. Evening usage is more likely to exceed the battery capacity when it is relatively high.
This means that the battery can be fully utilised to offset relatively more costly evening electricity consumption with lower cost daytime solar generation.
Batteries aside, it’s worth remembering that consumers who have the flexibility to shift some of their electricity use to lower price periods, can still save on their bills. Consumers with batteries will still save money by shifting any additional electricity usage, once their batteries are depleted, to lower price periods, where they have the flexibility to do so.
Figure 3: The average Evening Peaker outperforms other NSW consumers.
There is a strong correlation between high annual load and increased battery value
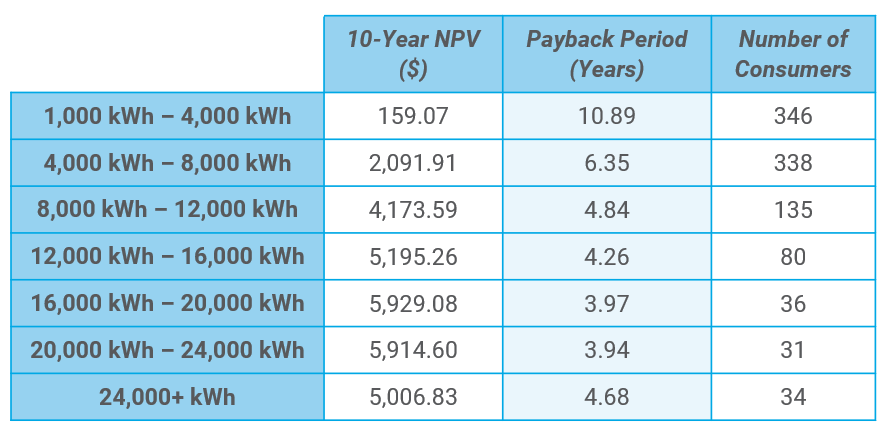
The more electricity an individual uses the more they can gain from installing a battery. With more consumption to shift, high load consumers make more frequent use of a battery's capacity and increase their return on investment. Additionally, higher consumption allows for a bigger battery, which can yield larger cashflow and benefits. For example, consumers in our dataset with annual loads between 4,000kWh-8,000kWh and 16,000kWh-24,000kWh saw average payback periods of 6.35 years and 3.95 years respectively, under the federal rebate scheme. We did test whether this was a distinct point from being an Evening Peaker and found that while there was a slightly stronger correlation between ‘high annual peak load’ and battery returns, this difference was not material.
Figure 4: In general, increasing annual load results in higher battery benefits. Figure assumes federal rebate is applied.
Consumers with consistent load usage across the seasons have an advantage under a Time of Use retail offering
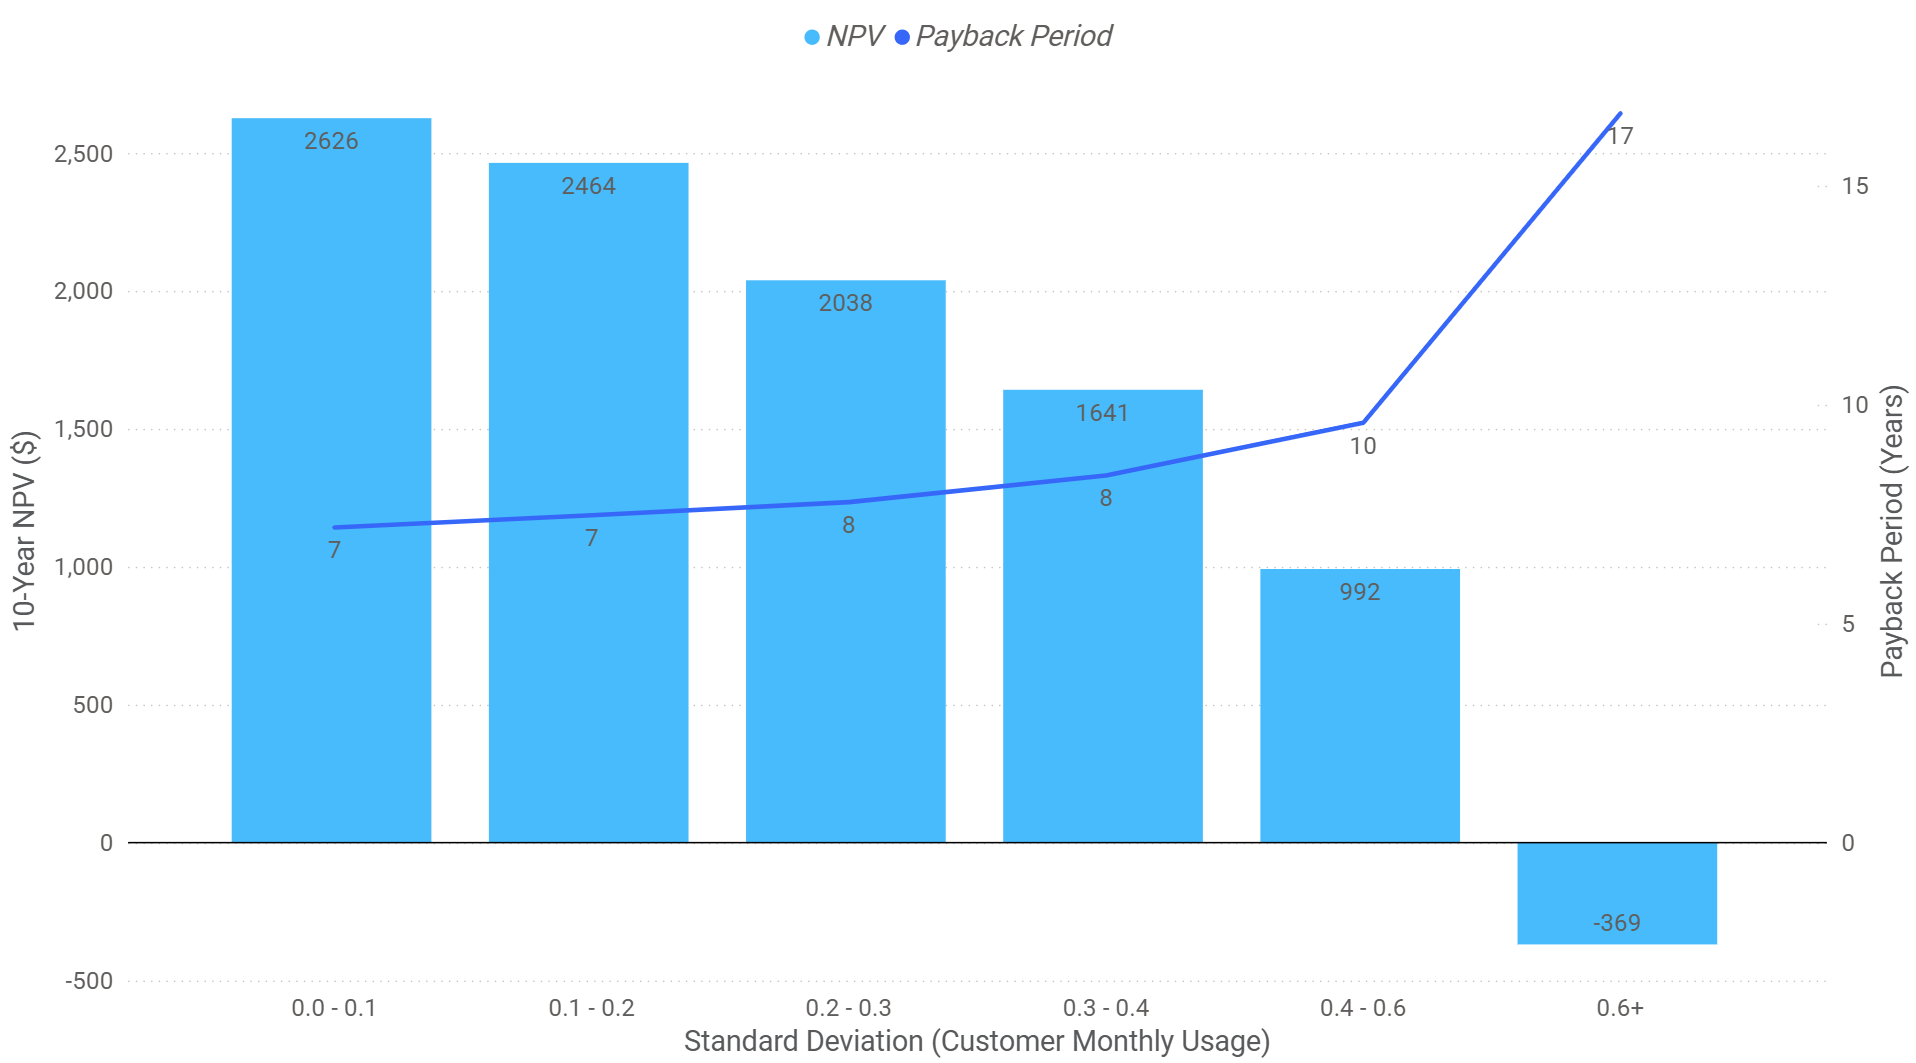
Consumers with consistent load patterns throughout the year are better positioned to use batteries efficiently. Variability in seasonal consumption makes it difficult to match battery size to consumer needs. For example, consumers in cold climates are likely to draw on their battery extensively for heating during winter but may not require as much electricity for cooling in warmer months. If not appropriately sized, battery performance becomes sub-optimal, an oversized battery may go underutilised and an undersized battery may miss opportunities to offset peak load. Our analysis shows consumers with lower month-to-month variation achieve shorter payback periods and higher NPV on average, see Figure 5 below. Note that in this case the standard deviation is measured for each consumer relative to their own average annual usage.
Figure 5: Consumers with more consistent usage across the year have better battery paybacks. Figure assumes federal rebate is applied.
Consumers who are battery smart can reap higher rewards
Not all batteries are created equal. Or at least this seems to be true when considering only theoretical battery economics.
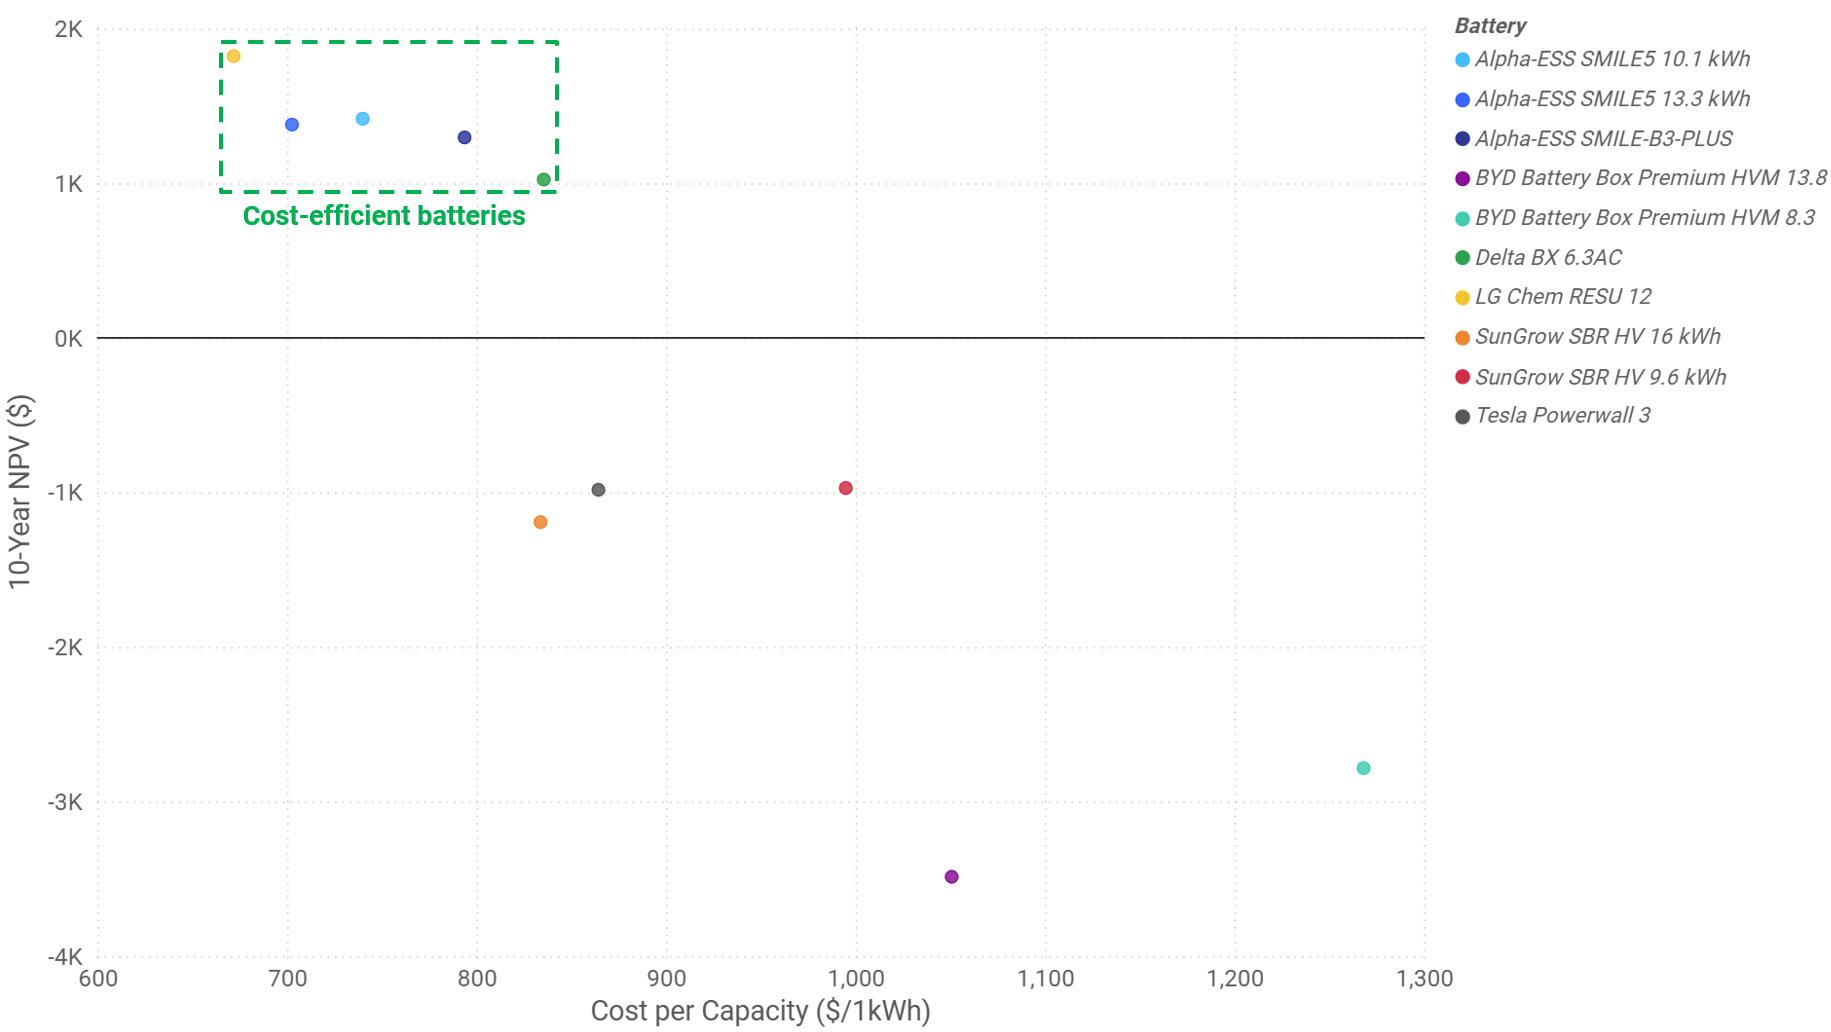
We analysed both premium batteries and cost-efficient alternatives. The results were clear: Lower-cost, less-known batteries outperformed premium-brand options on a financial basis. These lesser-known batteries typically have a lower cost per kWh of storage, which results in superior 10-year NPVs and shorter paybacks. Premium batteries, by contrast, often produced negative 10-year NPVs and failed to deliver a return within their warranty period (10 years). This result is evident in Figure 6 below and is reflective of current trends in Australia, with longtime favourites losing popularity and cost-efficient batteries jumping up the ranks (source).
Figure 6: Cost-efficient batteries show higher 10-year NPV than their premium counterparts. Figure assumes federal rebate is applied.
Individuals who size their solar and battery together can yield superior returns
Our analysis showed that individuals achieve better financial outcomes when they purchase solar and battery systems together rather than independently. This is because the performance and value of each are closely linked, and mismatched systems can limit returns.
If a solar system is undersized, a battery may remain undercharged, and benefits may be stunted. Alternatively, an oversized solar system can mean the consumer is overpaying. This suggests that there is no one-size-fits-all solution, and an optimal point for battery and solar size that best suits consumers' specific load and consumption patterns can be found.
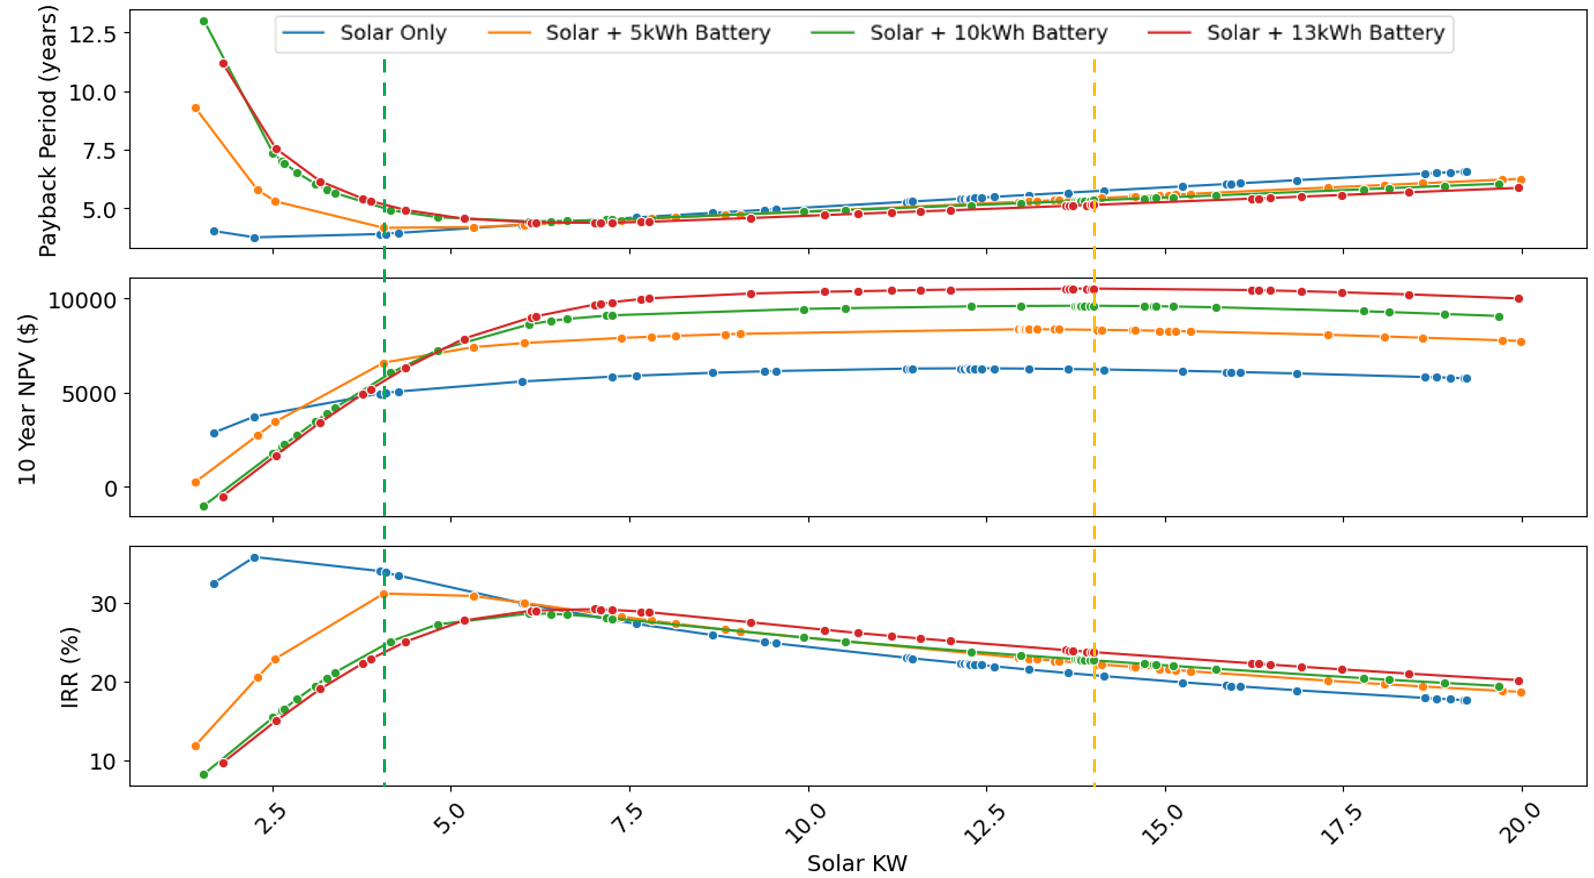
Based on an individual's characteristics, we identified the best system sizes to optimise for certain financial metrics. This revealed a "buyer's dilemma": Minimising the payback period often resulted in a smaller system with limited long-term returns, while maximising NPV required a higher initial investment and created longer payback periods. Consumers need to weigh both metrics to make the right decision for them and their risk profile.
Figure 7: Battery and solar sizing shows trade-off between fast payback and long-term gain. Results are indicative of a NSW consumer with 14,500kWh annual load average under the federal rebate scheme.
Wholesale pass-through can offer higher results, but potentially at the cost of higher cycling and reduced warranties
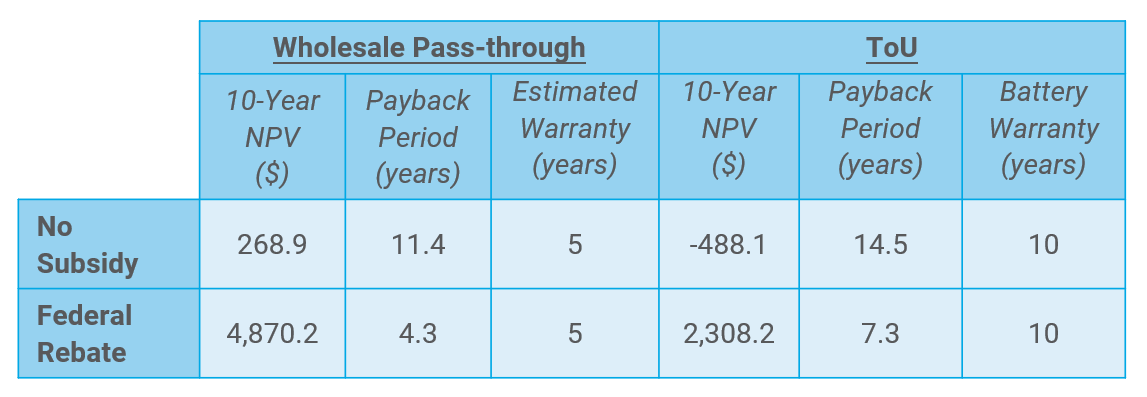
Some energy retailers offer wholesale pass-through pricing, where consumers are exposed to real-time spot prices. These highly volatile spot prices increase the arbitrage potential, but because of their fluctuating nature can lead to higher battery cycling (potentially up to twice as much as standard consumers on a ToU tariff). It should be noted that we did not constrain the number of times a battery could cycle per day in our model, but rather we simply attributed a degradation cost to the cycling. Other models in the industry may choose to cycle less frequently. Although the additional cycling behaviour may improve financial returns in our modelling, with NSW consumers averaging a 4-year payback and more than doubling their NPV after ten years, it can also reduce battery warranty due to exceeding cycling or throughput limits. This introduces higher risk and may lead to earlier battery failure outside of warranty coverage.
Figure 8: Wholesale pass-through can slash payback and halve battery warranty.
Virtual Power Plant participation can unlock further benefits
Virtual Power Plants, or VPPs, can take control of an individual’s battery and operate it to take advantage of high-price periods. In return, consumers will often receive annual payments and upfront incentives from the provider.
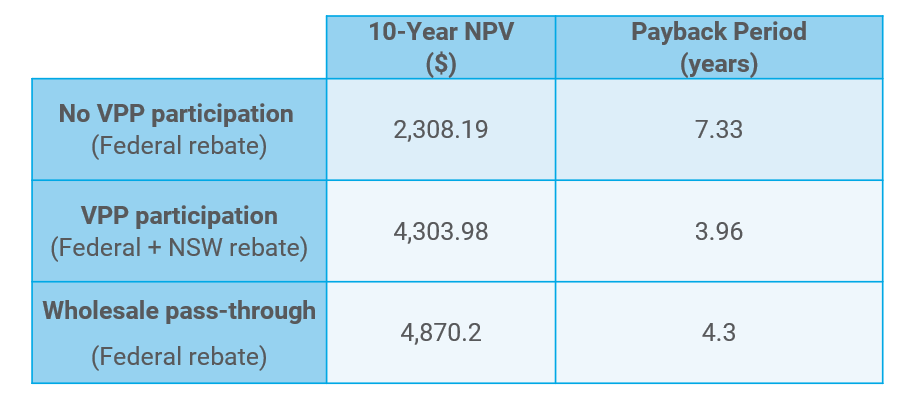
Additionally, as of July 2025, the NSW Government has doubled its VPP participation rebate and allowed it to be stackable with the federal rebate. This combination of factors means that NSW consumers in our sample who participate in VPPs can achieve the best of both worlds. On average, they would gain a 10-year NPV similar to wholesale pass-through consumers without the risk of being exposed to peaky, volatile prices, and receive shorter payback periods.
While these individuals may forgo some control of their battery (typically 50 days per year), the financial benefits more than offset any missed arbitrage opportunities.
Figure 9: VPP participation reaps similar benefits to wholesale pass-through.
Conclusion
Batteries in NSW, and likely at a NEM wide level, are at a tipping point. Evolving market conditions combined with substantial technology choices and government subsidies are increasing battery profitability. However, battery economics are far from uniform, and some consumers stand to gain more than others. The benefits are highly individualistic, and individuals who could see the strongest returns:
consume relatively heavily in peak periods
have a consistent seasonal usage
choose their solar and battery systems appropriately, and
take advantage of market offerings like VPPs or wholesale pricing.
Understanding consumption patterns and making informed, data-driven purchasing decisions is critical to unlocking the full value of batteries.